Since the election, there have been many arguments as to how the election ended. Many Democrat pundits believed that there was “overwhelming” support for Hillary Clinton. But, for some reason, yet to be found, Trump won. Many on the left were surprised at the end of the night.
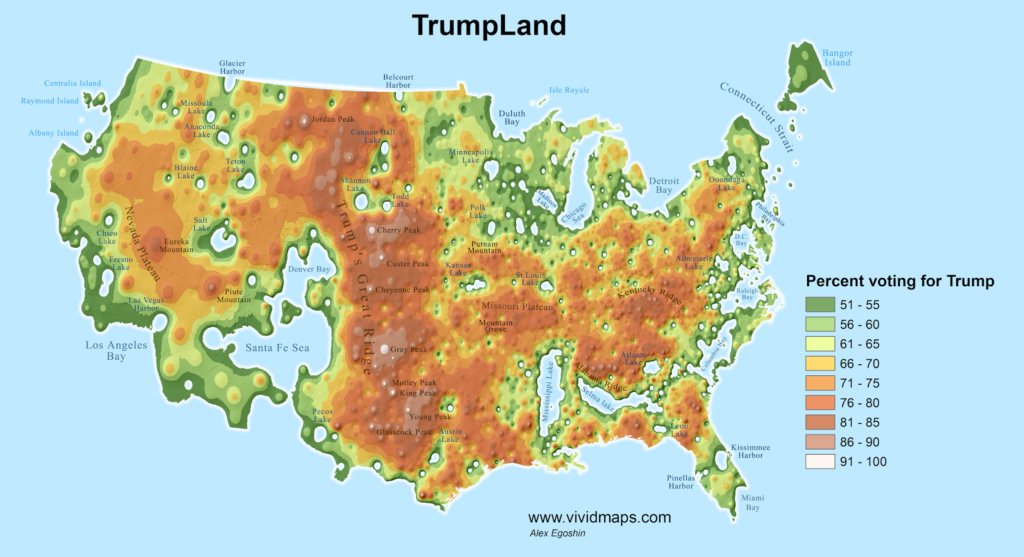
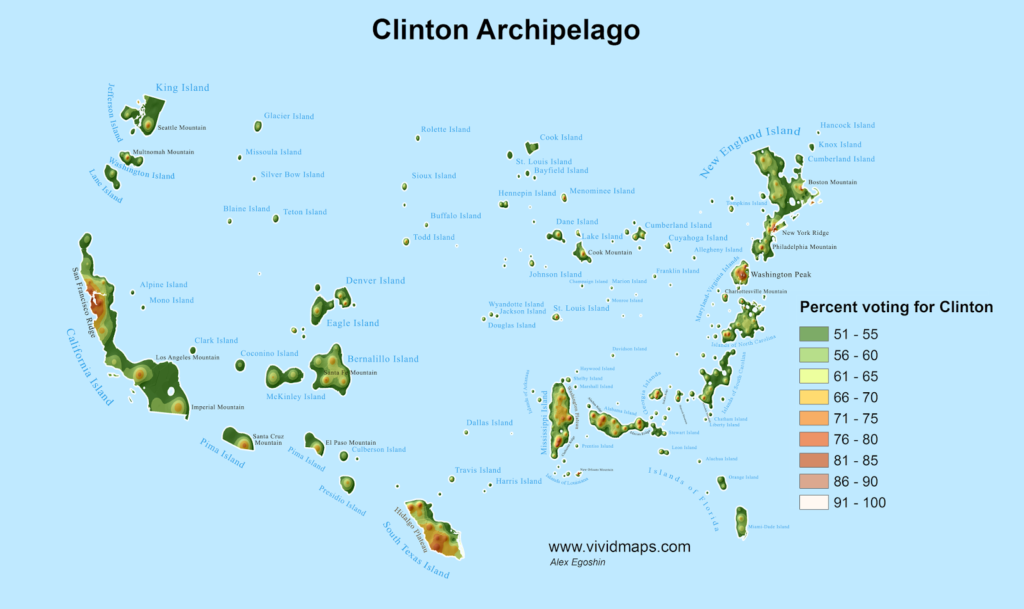
There are now good details about the United States 2016 Presidential Election results. The data from the election have been analyzed and many groups are trying to show different picture of that data. One such group, VividMaps, have done a great service and came up with Maps to show the data. These maps were created using IDW (Inverse distance weighted) technique in ArcGIS.
The first map is showing the Donald Trump Support:

Trumpland – by VividMaps
The second map is showing the Hillary Clinton Support:

Clinton_Archipelago – by VividMaps
The last map, is a county by county across the United States, showing both candidates results:

US_election 2016 – by VividMaps
Really, it all comes down to the Electoral College, NOT the Popular Vote. If it were, you can see which areas are overwhelmingly Democrat. The big over-populated cities.
Personally, the last map, shows the county to county wins, shows more WINNING for Trump.
Trump Won 2,626 Counties.
Hillary Only Won 487.
Go Trump! MAGA!

